
CCR, RCR and OCR are the Urban Redevelopment Authority's three market segments for private residential property: Core Central Region (prime central districts), Rest of Central Region (city fringe), and Outside Central Region (the suburbs). The classification drives everything from asking price to rental demand, with median per-square-foot values roughly S$1,000 apart between the priciest and cheapest tier. Before signing anything, always verify a property's actual region against URA's official map rather than a developer's marketing brochure.
TL;DR:
- Median property prices differ by approximately S$1,000 per square foot between CCR, RCR, and OCR as of first quarter 2026, affecting budget planning.
- Always verify a property's actual region using official URA maps or postal codes, especially when listings are near district boundaries.
- CCR attracts expatriates and investors seeking prestige but has higher vacancy rates and lower rental yields compared to RCR and OCR.
- OCR offers the highest rental yields and better affordability for HDB upgraders, making it suitable for cash flow-focused investment.
- Regional labels do not dictate permitted property types or building restrictions, which depend on specific zoning within each district.
Table of Contents
- What do CCR, RCR and OCR mean in Singapore property?
- How do you check which region a property is in?
- What does the region mean for buyers, renters and investors?
- How do you choose the right region for your situation?
- How can you model these scenarios before you buy?
- Why does Singapore even have CCR, RCR and OCR zoning?
- Do planning rules differ between CCR, RCR and OCR?
- Does the region limit what property types you can buy?
- Are the region boundaries changing over time?
- Which region offers the best rental demand and growth?
- What a decade of watching this market tells us
- Model your CCR, RCR and OCR options before you commit
- Sources
- FAQ
What do CCR, RCR and OCR mean in Singapore property?
Understanding CCR RCR OCR starts with recognising that URA built this system as a reporting framework, not a marketing label, even though agents now use it constantly in listings. Each postal sector in Singapore sits in exactly one of the three regions, and that assignment determines which price statistics a transaction feeds into; for local property listings and sold-property examples, check RegisterToday.
Core Central Region (CCR) covers the most expensive residential land in the country. It includes Districts 9, 10 and 11, plus the Downtown Core and Sentosa. Think Orchard Road, Marina Bay, Bukit Timah and River Valley. These are the addresses that anchor Singapore's luxury market and draw the most international attention.
Rest of Central Region (RCR) is the city-fringe band that sits between CCR and the suburbs. It includes parts of Districts 3 to 15 and 20, covering neighbourhoods such as Queenstown, Kallang, Toa Payoh and pockets of Novena. This is the region agents love calling the "sweet spot", and the label has some basis in the data, as it often blends city access with more manageable pricing.
Outside Central Region (OCR) takes in everything else, roughly Districts 16 to 27. Tampines, Jurong, Punggol and Woodlands sit here, alongside most of Singapore's newer HDB-adjacent private launches.
Here is how the three regions compared on median PSF as of Q1 2026, based on URA's property market information:
- CCR: approximately S$2,650 per square foot
- RCR: approximately S$2,180 per square foot
- OCR: approximately S$1,650 per square foot
Those medians hide a wide spread within each region. A CCR figure of S$2,650 blends ultra-luxury penthouses with smaller, lower-quantum units in the same district, so two "CCR" listings can differ by hundreds of dollars per square foot depending on the building, floor and view. The medians are a starting point for budgeting, never a quote.
How do you check which region a property is in?
Listings sometimes stretch the truth on region, especially when a development sits near a boundary. Confirming the actual classification takes a few minutes and three simple checks.
- Search URA's property market information portal using the project name or postal code. The result will show which district and region the transaction data is filed under.
- Cross-check with OneMap by entering the address. OneMap's planning layers show the URA classification alongside zoning and land use, which is useful when a development straddles a district line.
- Read the postal code itself. The first two digits map to a postal sector, and URA's own definitions page confirms which region each sector belongs to, so you can double-check any figure an agent quotes you.
Large mixed-use developments occasionally sit right on a district boundary, so it pays to check the specific block rather than assume the whole project shares one label.
What does the region mean for buyers, renters and investors?
Region shapes who else is bidding against you and who else is competing for your tenant, which matters more than most buyers realise until they are mid-transaction.
CCR tends to draw expatriates, high-net-worth locals and investors chasing prestige addresses. That pool is smaller and more cyclical, and market commentary consistently points to higher vacancy rates and lower gross rental yields in CCR compared with the other two regions. RCR attracts a broader mix, often families and professionals wanting city access without CCR pricing, and frequently delivers the more balanced yield-to-capital-growth profile investors look for. OCR is where HDB upgraders concentrate, chasing more space per dollar and a rental pool built largely from locals and long-term tenants, which tends to keep vacancy tighter and gross yields higher.
Pro Tip: Don't assume a lower PSF means a worse investment. OCR's higher gross yields often offset its slower capital appreciation, so the right choice depends on whether you need cash flow now or a long-term capital gain.
Median PSF gaps between the three regions run close to S$1,000, with CCR near S$2,650, RCR near S$2,180 and OCR near S$1,650 as of Q1 2026, according to URA data. That gap alone can shift a S$1.5 million budget from a compact CCR unit to a substantially larger OCR home.
Financing rules do not change by region. ABSD and BSD rates apply uniformly regardless of whether the unit sits in Orchard or Punggol, and IRAS confirms the brackets are set by citizenship status and property count, not location. What changes is the cash impact: a higher CCR quantum means a proportionally larger stamp duty bill and a CPF Ordinary Account that gets exhausted faster against the valuation limit. Many OCR buyers are HDB upgraders for exactly this reason, since their CPF balance stretches further against a lower purchase price, a pattern HDB's own guidance touches on when discussing upgrader pathways.
Appreciation does not follow the three-letter label neatly either. Some RCR pockets have outpaced CCR over recent years on the back of new MRT lines, which is a reminder that estate-level fundamentals often matter more than the regional bucket.
How do you choose the right region for your situation?
Match the decision to your own life stage and holding period rather than the region's reputation alone.
- Weigh the commute against the CCR premium. If your workplace sits in the central business district, ask whether the time saved justifies paying roughly S$500 to S$1,000 more per square foot than RCR.
- Model the full cost, not just the price. Add ABSD, BSD and factor in how far your CPF Ordinary Account will stretch at each region's typical quantum.
- Check rental demand at the estate level, not the region level, since vacancy varies block by block within the same district.
- Look for planned MRT lines or URA master plan changes near your shortlist, as these have shifted RCR and OCR values meaningfully in the past.
- Decide your holding period before you decide your region. A short hold rarely justifies the CCR premium, while a long hold can absorb slower early appreciation in exchange for higher rental yield.
Pro Tip: If you're torn between two regions, run the numbers on a five-year hold and a ten-year hold separately. The region that wins on a short horizon is often not the one that wins on a long one.
How can you model these scenarios before you buy?
Comparing CCR, RCR and OCR options properly means checking real district-level data rather than relying on an agent's pitch. Property analysis dashboards surface trend and valuation data by district, so you can see how a specific postal sector's PSF has moved rather than relying on the regional average alone. An affordability tool models how CPF usage, loan-to-value limits and monthly repayments shift as you move a target price between OCR, RCR and CCR scenarios, which makes the cash-flow trade-off concrete instead of theoretical.
- District-level valuation ranges to sanity-check a listed asking price
- Affordability modelling that shows CPF and LTV impact at different price points
- Property analysis views that track how a specific estate has moved relative to its regional average
Why does Singapore even have CCR, RCR and OCR zoning?
URA's three-tier system exists primarily as a statistical tool, introduced to give the market a consistent way to report private residential price movements without conflating a Marina Bay penthouse with a Punggol condominium. Before the classification matured, price commentary tended to lump all private housing together, which masked how differently the central core behaved compared with the suburbs during property cycles.
The regions also mirror decades of planning intent. Singapore's Concept Plan and Master Plan have long treated the central area as the commercial and lifestyle core, the city fringe as a transition zone for higher-density living close to the centre, and the outer regions as the residential heartland built around HDB towns and, later, private developments that followed the same new-town model. CCR's boundaries roughly track the historical downtown core; RCR fills the space URA earmarked for decentralisation as the city grew outward; OCR corresponds to the new towns built from the 1970s onward, from Woodlands to Tampines.
The classification now does double duty. Government bodies use it to track price segmentation and cooling measure effectiveness, while buyers and analysts use it as shorthand for budget expectations. That second use has stretched the system beyond its original statistical purpose, which is part of why region labels sometimes obscure more than they reveal at the estate level.
Do planning rules differ between CCR, RCR and OCR?
Planning controls attach to specific zoning within URA's Master Plan, not to the CCR, RCR or OCR label itself, which surprises many buyers who assume the region dictates what can be built. A CCR site zoned for landed housing faces the same restrictions as a landed plot anywhere else; the region only tells you which price bracket the surrounding market sits in.
That said, practical differences do show up because of where each region sits geographically. CCR concentrates commercial, hotel and high-density residential zoning around the Downtown Core and Marina Bay, reflecting its role as the business and tourism core. Height limits and plot ratios there tend to run higher to maximise land value in a constrained footprint. RCR mixes medium and high-density residential zoning with commercial nodes at transport hubs, a pattern URA has leaned into through city-fringe rejuvenation projects. OCR carries the most land zoned for lower to medium-density residential use, built around HDB new towns, with commercial zoning concentrated at regional centres like Jurong East and Tampines.
Development charge rates, which developers pay to intensify land use, also vary by sector rather than by CCR/RCR/OCR grouping, so two plots in the same region can face different charges depending on their specific zoning. The practical takeaway is that regional labels describe market pricing far more reliably than they describe what you are legally allowed to build.
Does the region limit what property types you can buy?
Zoning within each region allows a broad and overlapping mix of residential, commercial and mixed-use property, so the CCR/RCR/OCR label itself does not gate what type of property exists there. What differs is the concentration of each type.
CCR carries the highest density of mixed-use developments, integrated projects that stack retail podiums beneath residential towers, reflecting its role as a commercial as well as residential centre. Prime condominiums, serviced apartments and landed housing in pockets like Bukit Timah all sit within CCR too. RCR blends private condominiums with a meaningful share of executive condominiums and commercial shophouses, particularly around older estates now undergoing rejuvenation. OCR contains the largest share of Singapore's private residential land zoned purely for medium-density housing, alongside the HDB towns that surround it, with commercial use concentrated at regional hub developments.
Landed housing exists in all three regions, though CCR's landed pockets (Bukit Timah, parts of the Tanglin area) carry a premium that reflects scarcity as much as location. Executive condominiums, a hybrid public-private housing type, are built almost exclusively in RCR and OCR, since land parcels for ECs are rarely released within CCR boundaries. This matters if your search includes EC eligibility, since it effectively narrows your regional options from the outset.
Are the region boundaries changing over time?
Region boundaries have stayed broadly stable for years, but the market inside them keeps shifting, and URA periodically reviews district assignments as new towns mature and transport infrastructure changes travel times. The most visible recent driver has been MRT expansion. New lines and stations have pulled several RCR and OCR estates closer to central-area travel times, which has fed directly into the price convergence seen in some city-fringe pockets.
Analysis from NexDoor points to specific RCR and OCR pockets that have outperformed parts of CCR over recent years, largely on the back of new rail connectivity and city-fringe redevelopment. That performance gap is a useful reminder that a region label fixed decades ago does not automatically reflect today's connectivity or demand.
Looking ahead, URA's ongoing decentralisation push, exemplified by regional centres like Jurong Lake District and the Greater Southern Waterfront, is likely to keep blurring the practical distinction between OCR and RCR over the coming years, even if the formal boundaries stay the same. Buyers with a long holding horizon should treat announced Master Plan projects as more predictive of future value than the current CCR/RCR/OCR label.
Which region offers the best rental demand and growth?
Rental demand and capital appreciation do not move in lockstep across the three regions, and the trade-off tends to favour a different priority depending on what you are optimising for.
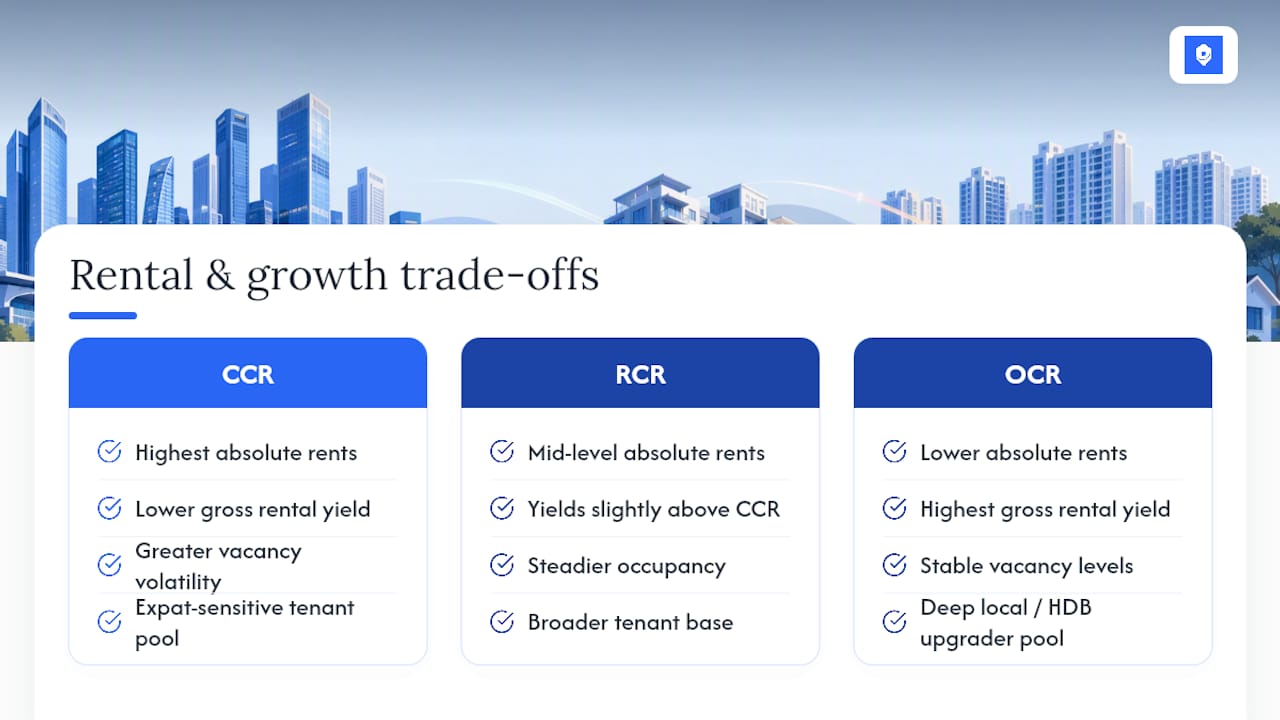
CCR generally commands the highest rents in absolute dollar terms but a lower gross yield, because purchase prices run so high relative to achievable rent. It also shows greater vacancy volatility, particularly when expatriate inflows slow, since that tenant pool is more sensitive to hiring cycles at multinational employers. RCR tends to sit in the middle on both counts, with steadier occupancy from a broader tenant base and yields that often edge out CCR without sacrificing much liquidity at resale. OCR typically delivers the highest gross rental yields of the three, supported by a deep, stable pool of local tenants and HDB upgraders, though absolute rents and capital growth per transaction tend to be lower in dollar terms.
Capital appreciation follows a similar split but with more noise. CCR growth tends to track global wealth cycles and can lag during downturns, while RCR has shown some of the strongest recent gains where new transport links landed. OCR appreciation tends to move with broader wage growth and HDB upgrader demand, delivering steadier but generally smaller percentage gains over a typical holding period. None of this holds evenly at the estate level, which is exactly why checking a specific project's transaction history matters more than trusting the regional average.
What a decade of watching this market tells us
Buyers spend too much energy debating which region is "best" and too little time checking whether their chosen estate actually performs the way its region suggests it should. Region tells you the price bracket and the general tenant pool; it does not tell you whether a specific block near an ageing shopping centre will rent as easily as one beside a new MRT interchange. Match the region to your holding period and lifestyle, not the other way round, and confirm every assumption against URA's own data before you commit.
— HAIO
Model your CCR, RCR and OCR options before you commit
Reading about median PSF ranges only gets you so far when you're staring at a specific unit and a specific price. Haio's affordability tool lets you plug in a target budget and see exactly how CPF limits, loan-to-value caps and monthly repayments shift as you move between a CCR, RCR or OCR scenario, so the trade-off stops being abstract. Pair that with the property analysis dashboards for district-level valuation trends, and you get a clearer read on whether a listed price reflects the regional median or sits well outside it. If you're ready to compare region scenarios side by side, haio+ unlocks the deeper valuation reports and market analysis at S$49 per month or S$499 per year, giving you the data to back your decision before you make an offer.
Sources
- URA property-market information / PMI (Residential pipeline & private units)
- LovelyHomes — CCR vs RCR vs OCR Singapore 2026 guide
- URA — definition of data terms / how URA categorises data
FAQ
What is the difference between CCR, RCR and OCR?
CCR is Singapore's prime central region, covering districts like Orchard and Marina Bay. RCR is the city fringe, and OCR covers the suburban heartland. The main practical difference is price, with median PSF running from roughly S$2,650 in CCR down to S$1,650 in OCR as of Q1 2026.
What are the CCR, RCR and OCR districts in Singapore?
CCR covers Districts 9, 10 and 11 along with the Downtown Core and Sentosa. RCR spans parts of Districts 3 to 15 and 20, including Queenstown and Toa Payoh. OCR covers the remaining Districts 16 to 27, including Tampines, Jurong and Woodlands.
Is Bugis CCR or RCR?
Bugis sits within a district which URA classifies as part of the Rest of Central Region. It sits close to the CCR boundary given its proximity to the Downtown Core, but it is officially RCR, so always confirm against URA's mapping rather than assuming from location alone.
Is Clementi RCR or OCR?
Clementi falls under a district that URA classifies as Rest of Central Region rather than Outside Central Region. This surprises some buyers who expect a western suburban estate to sit in OCR, which is a good example of why checking the official district assignment matters more than guessing from geography.
How do I check which region a property is in?
Search the project name or postal code on URA's property market information portal, which shows the district and region a transaction is filed under. You can cross-check the result using OneMap or by looking up the postal sector directly.