

The private residential property price index rose slightly in the first quarter of 2026, similar to the average quarterly pace seen through 2025, according to the Urban Redevelopment Authority (URA). The HDB resale price index, tracked separately by the Housing & Development Board and published through SingStat, continues to climb at a steadier rate. Analysts and buyers alike can now cross-reference both series through data.gov.sg or an applied tool such as Haio to convert these figures into a working valuation.
TL;DR:
- Private residential prices are rising at a steady quarterly rate of around 0.8% to 0.9%, reflecting consistent demand without sharp spikes.
- Private index movements are mainly driven by new launches and high-value caveats, while HDB resale prices respond more to owner-occupier activity.
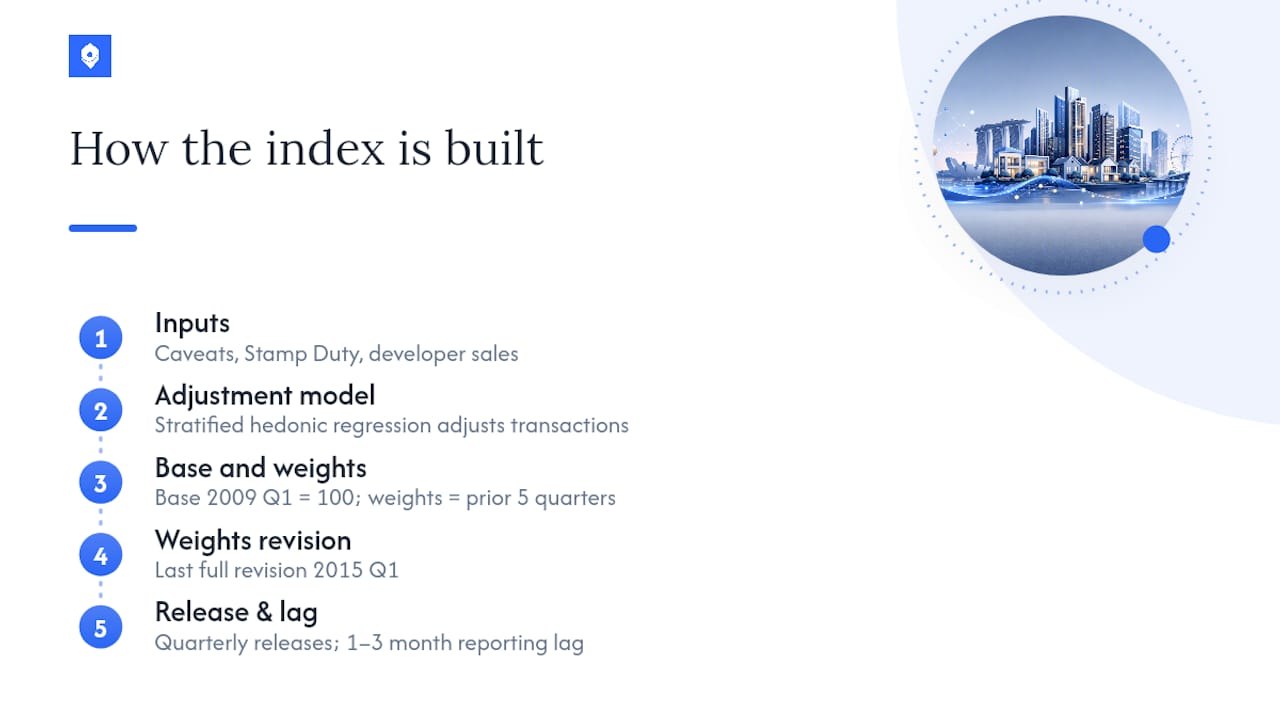
- The index is based on transaction caveats, Stamp Duty data, and developer sales, adjusted for property features using a hedonic regression model.
- Long-term trends show the index near historic highs, supported by resilient demand and stable macroeconomic conditions.
- The index should be used as a trend indicator for market comparison, not as a precise valuation tool for individual properties.
Table of Contents
- What is Singapore's property price index right now?
- How do HDB resale and private prices differ this quarter?
- How Is the Property Price Index Calculated?
- What does the historical trend tell investors?
- How should you actually use the index?
- Applying the index with Haio: an example workflow
- An analyst's read on the numbers
- How Haio helps you monitor the index
- Sources
- FAQ
What is Singapore's property price index right now?
The URA's overall private residential price index climbed modestly quarter-on-quarter in the first quarter of 2026, extending a run of consistent, moderate gains rather than a sharp spike. That figure comes directly from the URA's Release of 1st Quarter 2026 real estate statistics, which also carries the regional annexes analysts use to see where the growth actually sits.
SingStat's own data tables report the private residential index at a level above 200 points and the HDB resale price index at a slightly lower level for the same quarter, both measured against their respective base periods. These numbers rarely move in lockstep. Private residential values react faster to new launches and high-value caveats, while HDB resale prices track owner-occupier demand and the flow of flats reaching their Minimum Occupation Period.
Both series are freely downloadable, and cross-checking the headline percentage against the raw index level is worth doing before citing either figure in a report.
How do HDB resale and private prices differ this quarter?
Private residential and HDB resale prices are moving on separate clocks this quarter, and the gap tells you something about where actual demand is concentrated. Private prices are being pulled along partly by new-launch activity and caveats on higher-value units, which the URA's rolling weights pick up faster than a broad resale market would show.
The regional annex behind the headline number breaks the picture down further:
- Core Central Region (CCR): typically the most sensitive to individual high-value transactions, so a single luxury caveat can swing the quarterly print.
- Rest of Central Region (RCR): often the bellwether for city-fringe demand, sitting between CCR volatility and OCR stability.
- Outside Central Region (OCR): usually the most representative of mass-market, owner-occupier sentiment.
- Landed vs non-landed: landed housing tends to show sharper swings quarter to quarter simply because transaction volumes are far lower, which investors should weigh before treating a landed move as a market-wide signal.
How is the property price index calculated?
The URA's private residential index is built from caveats lodged on transactions, supplemented by Stamp Duty records and developer new-sale data where caveats lag behind actual sales. Those inputs feed a stratified hedonic regression model, a statistical technique that adjusts each transaction for differences in location, size, tenure, and age before comparing prices across quarters, so the index tracks genuine price movement rather than a shift in what happened to sell that quarter.
The series uses a base quarter of 2009 Q1, set at 100, and applies weights drawn from the value of properties transacted over the preceding five quarters, a detail documented on data.gov.sg's Private Residential Property Price Index dataset. Those weights are revised periodically, with the last full revision dated to 2015 Q1, which means a run of unusually large transactions can nudge short-term index composition more than a casual reader might expect.
New figures typically follow the URA's quarterly release cycle in January, April, July, and October. Because the underlying data relies on lodged caveats, there is usually a reporting lag of one to three months between a transaction happening and its showing up in the published index.
What does the historical trend tell investors?
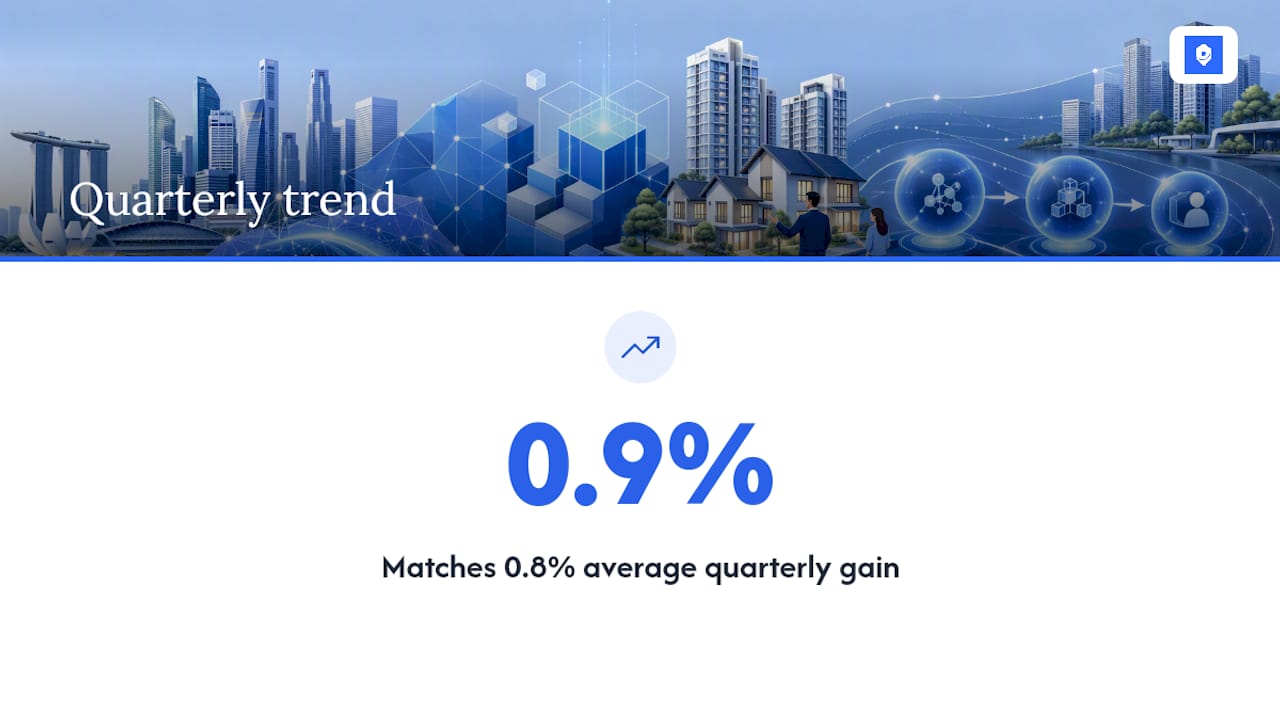
Singapore's private residential index has posted an average quarterly gain of 0.8% through 2025, and the first quarter of 2026 sits almost exactly on that trend line at 0.9%. That consistency is itself the story: this isn't a market lurching between spikes and corrections, but one grinding higher in small, repeatable steps.
Longer-run series tracked through aggregators such as TradingEconomics, which source their figures from URA and SingStat, show the index sitting near historic highs, a pattern that reflects sustained occupier demand rather than a single speculative wave. Commentary from The Business Times points to structural fundamentals, resilient occupier demand and a stable macro backdrop, as the real support beneath the headline percentages.
Two policy variables matter more than usual heading into the rest of 2026: the pace of Government Land Sales (GLS) supply reaching the market, and where mortgage rates settle. A larger-than-expected GLS pipeline tends to cap upside in the following quarters, while any mortgage-rate movement changes affordability faster than the index itself can react. Treat one quarter's number as a data point, not a verdict.
How should you actually use the index?
The index is a trend tool, not a valuation calculator, and confusing the two is the most common mistake readers make.
Four uses it's genuinely good for:
- Trend confirmation — checking whether a neighbourhood or segment is moving with the broader market or against it.
- Relative valuation — comparing how CCR, RCR, and OCR have moved relative to each other over several quarters.
- Cross-checking new launches — testing whether a developer's asking prices track ahead of, or behind, the wider index.
- Rental comparison — pairing price index movement against rental trends to gauge yield compression or expansion.
Four ways it gets misused: treating the latest print as current given the one to three month caveat lag; ignoring seasonality around festive periods and launch cycles; drawing conclusions from a single landed-property segment with thin transaction volumes; and anchoring a decision to one quarter's figure instead of a four-quarter run.
Pro Tip: *Before citing any single quarter's index move, check the regional annex behind it.
Applying the index with Haio: an example workflow
A practical sequence looks like this: read the URA release, then update your property's estimated value using Haio's instant valuation tool, then run an affordability check against current mortgage rates, then decide whether to buy, hold, or refinance.
- Instant valuation to reflect the latest index movement
- Affordability check against income and existing commitments
- Mortgage-rate comparison across current offers
- Market news to flag any GLS or policy shift affecting the next quarter
An analyst's read on the numbers
Momentum looks steady rather than accelerating heading into the next quarter. Watch the GLS confirmed list and mortgage-rate trajectory closely, both will move faster than the index itself.
— HAIO
How Haio helps you monitor the index
Reading a quarterly URA release is one thing; knowing what it means for your own property or shortlist is another. It's built to sit alongside official releases, not replace them, giving you a faster way to sense-check a listing price or refinancing decision the moment new figures land. Start by running your property or shortlist through Haio's valuation and affordability tools to see where it stands against the latest quarter's data.
Sources
- Release of 1st Quarter 2026 real estate statistics | Urban Redevelopment Authority (URA)
- Latest property price indices – SingStat
- Private Residential Property Price Index (Base Quarter 2009-Q1 = 100), Quarterly | data.gov.sg
- Looking beyond the headlines in Singapore's property market | The Business Times
FAQ
What Is the Current Residential Property Price Index in Singapore?
The URA's overall private residential price index rose 0.9% quarter-on-quarter in the first quarter of 2026, with SingStat reporting the private index at roughly 218.3 points and the HDB resale index at around 203.4 points for the same period.
Are Property Prices Falling in Singapore?
No.
What Are the Expected Property Prices in Singapore in 2026?
No official index forecasts exist, but analysts point to steady occupier demand, the pace of GLS supply, and mortgage-rate movements as the main variables likely to shape price direction through the rest of the year.
How Is the Property Price Index Calculated?
The index is built from caveats, Stamp Duty records, and developer sales data, processed through a stratified hedonic regression model that adjusts for property characteristics, weighted by transaction value over the preceding five quarters against a base of 2009 Q1.