

Every property valuation rests on one of three approaches: market (sales comparison), income, or cost. The market approach suits frequently traded homes and land, the income approach fits rented or investment assets, and the cost approach applies to specialised or newly built structures where comparable sales are scarce. Specialist techniques such as residual, profits, and summation methods handle unusual cases where none of the three works cleanly on its own.
TL;DR:
- The sales comparison approach is most suitable for traded residential and commercial properties, relying on recent comparable sales adjusted for time, location, size, and condition.
- The income approach is best for income-generating assets, using net operating income and either direct capitalisation or discounted cash flow methods, with market-derived cap rates preferred.
- The cost approach applies mainly to specialised or new structures, summing land value with depreciated replacement or reproduction costs, while accounting for physical and functional obsolescence.
- Physical inspections remain crucial for accurate condition assessment, as they uncover issues that surface-level data or photos might miss, influencing adjustments and depreciation estimates.
- Legal and regulatory factors, including zoning, tenancy laws, and heritage restrictions, significantly impact valuation methods and final figures; ignoring these can lead to inaccurate results.
Table of Contents
- What separates a valuation approach from a valuation method?
- Sales comparison approach: selecting and adjusting comparables
- Income approach: building NOI, cap rates and when to use DCF
- Cost approach: replacement cost and depreciation
- Residual, profits, and other specialist techniques
- How to choose the right valuation approach
- What limits the accuracy of every valuation method?
- Why physical inspections still matter in a data-driven market
- How legal and regulatory factors shape a valuation
- Key valuation terms worth knowing
- Standards guide the method, but judgement still decides the figure
- Get valuation-grade data without building it yourself
- Sources
What separates a valuation approach from a valuation method?
Practitioner guidance draws a firm line between the two terms, and conflating them is a common source of confusion for anyone new to appraisal work. An approach is one of three broad economic routes to value: market, income, or cost. A method is the specific technique applied within that approach, such as the comparable method (market), the investment method or discounted cash flow (income), and depreciated replacement cost (cost). The Valuation Protocol issued under API guidance sets out this structure explicitly, and warns that no single approach applies in every circumstance.
Three economic principles sit underneath all three approaches:
- Price equilibrium: value settles where supply and demand for comparable assets meet, which is why active markets produce the most reliable comparable evidence.
- Anticipation of benefits: income producing assets are valued on the returns they are expected to generate, not simply their physical attributes.
- Substitution: a rational buyer will not pay more for a property than the cost of acquiring an equally desirable substitute.
Both the RICS Red Book and the International Valuation Standards direct valuers toward observable market inputs (actual transaction prices, quoted yields, agreed rents) ahead of non-observable assumptions wherever the evidence exists. That preference for what the market has actually done, rather than what a model predicts it should do, runs through every method described below.
Sales comparison approach: selecting and adjusting comparables
The sales comparison approach is generally the most direct route to value for commonly traded residential and commercial properties, because it relies on what buyers have actually paid rather than on projected income or rebuild costs. The core task is finding transactions similar enough to the subject property, then adjusting for the differences that remain.
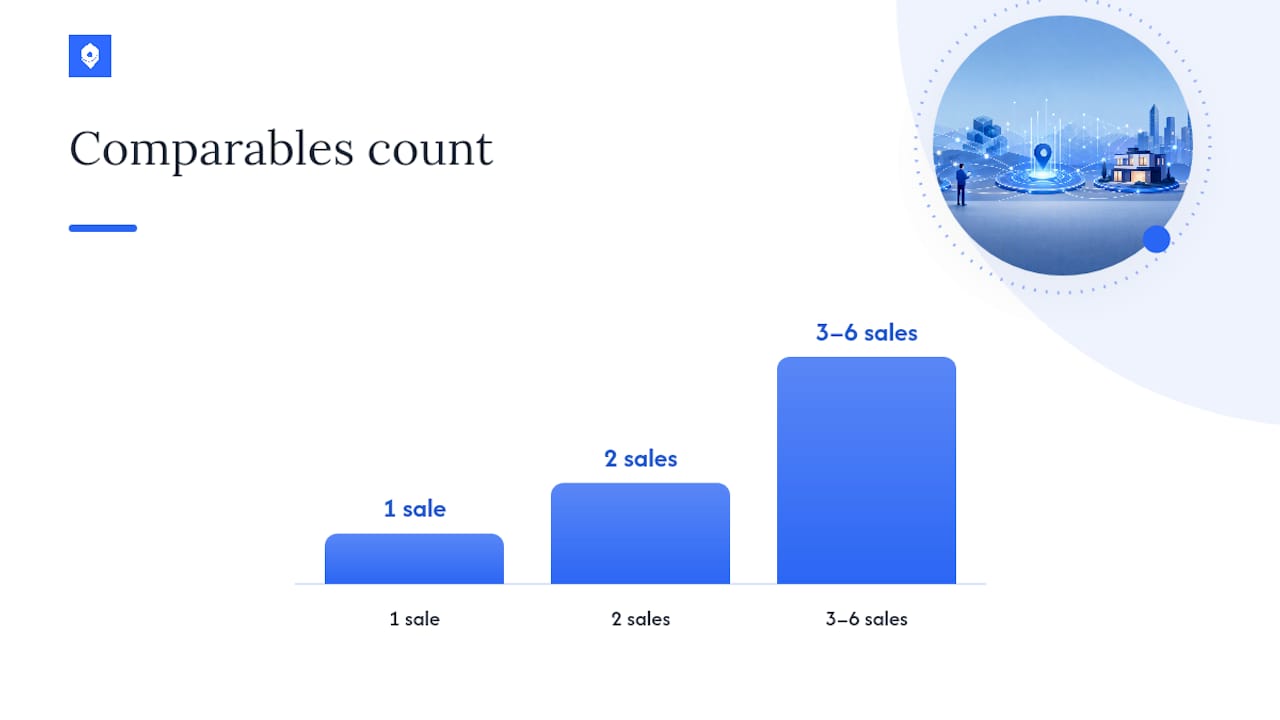
Comparables are usually expressed per unit of comparison, whether that is price per square metre, price per bedroom, or price per hectare for land. Once you have three to six recent, genuinely comparable sales, you adjust each one for the differences that matter:
- Time — has the market moved since the comparable transacted? A sale six months old in a rising market needs an upward adjustment.
- Location — a plot two streets over on a busier road is not the same asset, even at an identical size.
- Size and configuration — larger units often sell at a lower price per square metre than smaller ones, so a straight-line adjustment can mislead.
- Condition — a renovated kitchen or a leaking roof can swing value by a meaningful percentage, and this is where a physical inspection earns its keep.
The main pitfall is a thin market. When only one or two comparable sales exist in the past twelve months, the adjustments carry more weight than the evidence justifies, and confidence in the final figure should drop accordingly. Cross-checking against a different approach becomes far more important in these conditions.
A basic comparable valuation runs through five steps: define the unit of comparison, gather at least three qualifying sales, adjust each for time, location, size and condition, weight the adjusted results by how closely each comparable matches the subject, and reconcile them into a single supported figure, as explained by AAS Home Buyers.
Pro Tip: When comparables are scarce, widen the geographic search radius before you widen the date range. A slightly further comparable from last month is usually more reliable than a nearby one from two years ago.
Income approach: building NOI, cap rates and when to use DCF
The income approach converts a property's earning power into a present value, and it is the standard route for rented residential blocks, offices, retail units, and any asset bought primarily for its cash flow. Everything starts with net operating income (NOI): gross rental income, less vacancy allowance, less operating expenses, before financing costs and depreciation.
Two techniques sit under this approach, and the choice between them depends on how stable that income is:
- Direct capitalisation applies the IRV formula (Income ÷ Rate = Value) to a single year's stabilised NOI. It works well for assets with steady, predictable income and a clear market-derived capitalisation rate.
- Discounted cash flow (DCF) forecasts income year by year across a holding period, typically five to ten years, then adds a terminal value based on an exit capitalisation rate, and discounts the whole stream back to present value using a required rate of return.
Deriving a defensible cap rate is where most errors creep in. Practitioners typically triangulate between rates implied by comparable investment sales, band-of-investment calculations that blend debt and equity return requirements, and prevailing investor yield expectations for the asset class, checking that all three point in a similar direction before settling on a figure.
Guidance on discounted cash flow valuation stresses that observable market transactions should carry more weight than assumptions built into a DCF model. A DCF output that diverges sharply from what comparable investment sales imply is a signal to revisit the forecast assumptions, not a signal to trust the model over the market.
The income approach depends on the quality of the income and expense data behind it. Reconstructed statements that smooth out one-off repair costs or overstate achievable rent produce a value that looks precise and is actually built on shaky foundations.
Cost approach: replacement cost and depreciation
The cost approach sums land value and the depreciated cost of improvements, and it becomes the primary method when a property is too specialised or too new for reliable comparables or income data to exist, think schools, places of worship, or a factory built eighteen months ago.
Two cost concepts matter here:
- Reproduction cost estimates what it would cost to build an exact replica using the same materials and design, including any outdated features.
- Replacement cost estimates what it would cost to build a modern equivalent with the same utility, using current materials and standards, which usually produces a lower and more realistic figure.
Depreciation then gets deducted in three forms: physical deterioration (wear and tear), functional obsolescence (an outdated layout or inefficient systems), and external obsolescence (value lost because of factors outside the property, such as a declining local area).
For most everyday residential and commercial valuations, the cost approach serves as a cross-check against the market or income figure rather than the lead method, precisely because depreciation estimates involve more judgement than a well-supported comparable sale.
Residual, profits, and other specialist techniques
Some properties do not fit neatly into any of the three main approaches, and valuers reach for specialist techniques built to handle their particular quirks.
- Residual method: works backwards from gross development value (GDV) minus build costs, finance, and developer's profit to arrive at a land value. It is standard for development sites, but highly sensitive to assumptions about GDV and cost, so small input changes can swing the answer significantly.
- Profits method: values trading properties (pubs, hotels, care homes) based on the business's earning potential rather than its bricks and mortar, essentially an income approach applied to trade-dependent assets.
- Summation and hypothetical development models: valuers sometimes combine multiple techniques, summing separately valued components or modelling a hypothetical scheme, when a single method cannot capture the full picture.
How to choose the right valuation approach
Before picking a method, establish the highest and best use of the property. IVSC guidance treats this as foundational: the most valuable legally permissible use can differ from the current use, and that gap changes which approach applies.
Run through this checklist for any instruction:
- What is the purpose of the valuation? Mortgage security, sale advice, and insurance reinstatement each point toward different approaches.
- What type of property is it? A three-bedroom house points to market comparison; a leased office block points to income.
- How active is the local market? Plenty of recent sales favour comparison; a thin market pushes you toward income or cost as a cross-check.
- What data can you actually access? Rent rolls and expense statements you cannot verify weaken an income approach regardless of theory.
- Does highest and best use change the picture? A tired house on a large plot might be worth more as a redevelopment site, pointing toward the residual method instead.
A worked example: a tenanted two-bedroom flat with five comparable sales in the past six months and a steady rental history. Comparison gives you a fast, well-supported figure; the income approach, run in parallel using the actual rent, tests whether the sale price still reflects a sensible yield for that class of asset. Reconciling the two builds more confidence than either alone.
Dig into why they disagree, usually it is a stale comparable or an unrealistic rent assumption.*
What limits the accuracy of every valuation method?
No approach is immune from error, and knowing where each one tends to break down matters as much as knowing how to apply it. Sales comparison suffers most in thin or fast-moving markets, where too few transactions exist to support confident adjustments, or where recent sales already reflect a shift the valuer has not yet accounted for. Adjustment factors themselves are subjective; two valuers can reasonably disagree on how much a renovated kitchen adds.
The income approach is only as reliable as the income and expense data feeding it. Overstated achievable rent, understated vacancy allowance, or a capitalisation rate pulled from the wrong asset class all distort the output while still looking mathematically precise. DCF models compound this risk further out, since a ten-year forecast rests on assumptions about rental growth and exit yields that nobody can verify in advance.
The cost approach carries the heaviest judgement burden of the three, because depreciation, particularly functional and external obsolescence, cannot be measured directly. Two valuers applying the same replacement cost figure can land on different depreciated values depending on how they weigh those intangible losses.
Reconciliation guards against all three failure modes. Where more than one approach produces a reliable indication, best practice calls for stating the reasoning and weighting behind the final figure rather than presenting a single number as beyond question.
Why physical inspections still matter in a data-driven market
A valuation built entirely from desktop data misses what only a physical inspection can confirm: actual condition. Comparable adjustments for condition, cost approach depreciation allowances, and even income approach expense assumptions (a roof due for replacement changes near-term capital expenditure) all depend on someone actually walking the property.

An inspection typically checks structural condition, the age and state of major systems (roofing, heating, wiring), any visible defects or unauthorised alterations, and how the layout compares with the comparables used in the analysis. Photographs and floor plans help, but they routinely miss subsidence cracks, damp, or subtle signs of deferred maintenance that a trained eye catches on site.
Skipping the inspection does not remove the risk, it just hides it inside an assumption. A property assessed purely from listing photos and a floor plan can carry condition issues that only surface once adjustments or depreciation allowances turn out to be wrong. For buyers and small investors working through comparable sales themselves, a brief physical walk-through before finalising any figure is one of the cheapest checks available against an overstated valuation.
How legal and regulatory factors shape a valuation
Zoning and planning restrictions sit at the centre of highest and best use analysis, because a property's legally permissible use can differ sharply from its current use. A residential plot zoned for higher density carries development potential that a straightforward comparable valuation, based on similar houses, would understate entirely.
Tenancy law affects the income approach directly. Rent control provisions, statutory notice periods, and tenant protection rules all influence achievable rent and the ease of repositioning an asset, which feeds straight into NOI and the cap rate a buyer is willing to accept. Title issues, easements, and encumbrances can restrict use or access in ways that reduce value below what an unencumbered comparable would suggest.
Building and safety regulations matter for the cost approach specifically: reproduction or replacement cost estimates need to reflect current building codes, not the standards in force when the original structure went up, since a legal reinstatement must meet today's requirements. Heritage or conservation designations can also cap what alterations are permissible, which limits functional improvements a valuer might otherwise assume are achievable.
None of this is a substitute for legal advice on a specific transaction, but a valuer who ignores planning status, tenancy terms, or title constraints risks a figure that looks robust on paper and falls apart the moment someone tries to act on it.
Key valuation terms worth knowing
A handful of metrics recur across almost every valuation report, and understanding what they actually measure prevents misreading a figure that looks precise but means something narrower than it appears.
| Term | What it measures | Typical use |
|---|---|---|
| Capitalisation rate (cap rate) | Net operating income divided by property value, expressed as a percentage | Direct capitalisation under the income approach; also a shorthand for market yield expectations |
| Gross rent multiplier (GRM) | Sale price divided by gross annual rental income (before expenses) | Quick screening tool for residential rental properties; less precise than a full income approach |
| Net operating income (NOI) | Gross income less vacancy allowance and operating expenses, before financing and depreciation | The foundation figure for both direct capitalisation and DCF |
| Discount rate | The required rate of return used to bring future cash flows back to present value | DCF modelling, reflecting the risk profile of the asset and its income stream |
| Terminal value | The estimated resale value of an asset at the end of a DCF forecast period | Combined with the annual cash flows to complete a DCF calculation |
The GRM deserves a caveat: it ignores operating expenses entirely, so two properties with an identical GRM can have very different NOI once running costs are accounted for. It is a screening tool, not a substitute for a full income approach.
Standards guide the method, but judgement still decides the figure
The conventional advice on property valuation treats method selection as mechanical, match the property type to an approach and follow the formula. That undersells how much judgement sits inside every step: which comparables genuinely qualify, which cap rate actually reflects current investor sentiment, how much a dated kitchen really costs in adjusted value. The IVS, RICS Red Book, and API Valuation Protocol give the structure, but none of them remove the need for someone to weigh evidence and defend a number.
What gets overlooked most often is reconciliation. Readers tend to run one method, get a figure, and stop there. The stronger habit, and the one professional standards actually recommend, is running two approaches where the data allows it and treating any large gap between them as a warning rather than an inconvenience to average away.
Prioritise observable market evidence first: actual sales, actual rents, actual yields. Build assumptions only where the market genuinely offers nothing better, and be explicit about which figures in your valuation are evidence and which are estimates.
— HAIO
Get valuation-grade data without building it yourself
Every method above depends on the same scarce resource: reliable, current market data. Gathering enough qualifying comparables, checking a cap rate against recent investment sales, or tracking how rents have moved this quarter takes hours most buyers and small investors do not have. Haio exists to remove that bottleneck, giving you instant property valuations, comparable transaction data, and real-time market trend tracking in one place, rather than piecing figures together from scattered listings.
If you are working through a valuation on your own property or an investment target, Haio's tools let you pull comparable sales, run affordability checks, and compare current mortgage rates without starting from a blank spreadsheet. Readers who want the deeper analytics behind a cap rate or a rental trend can explore Haio's premium reports through haio+ for a fuller picture before committing to a figure.